The Gold Foil Experiment and The 250-Million-Ton Pea: The Composition of the Atom

This Atom Is Not To Scale

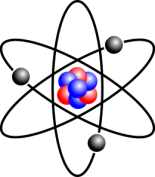
In a recent post about isotopic abundance, I used a prototypical image of a lithium atom to illustrate the basic structure of an atom.  However, the image was deliberately not drawn to scale to make the protons, neutrons, and electrons visible.  Let’s look at the basic composition of the atom to see why, and we owe this understanding to Ernest Rutherford.  First, let’s give some historical background about what motivated Rutherford to conduct this experiment; we first turn to the Plum Pudding Model by J.J. Thomson.

The Plum Pudding Model

Before 1911, the dominant theory of atomic composition was J.J. Thomson‘s “plum pudding” model.  Thomson hypothesized that an atom consisted of electrons as negatively charged particles (the “plums”) “floating” in a “pudding” of positive charge.

plum pudding model

Plum Pudding Model of the Atom

Source: Wikimedia Commons

Read more of this post

Getting Help with R Programming: Useful Survival Skills

Useful Resources to Learn about R on the Internet

When I program in R and struggle with something, the first thing that I usually turn to is Google.  I search the relevant function or the desired outcome, and I often find the solutions within the first few hits.  They likely show up in the documentation, online discussion forums like Nabble and Stack Overflow, email threads within the R Mailing List, and web sites that provide tutorials on R (like R-Bloggers and the UCLA Statistical Computing Group).  These are all great resources.

Today, however, I’m going to show you some useful survival skills within the R environment.  I read about these help facilities on Page 7 of the 3rd edition of the book “Data Analysis and Graphics Using R” by John Maindonald and W. John Braun.

Read more of this post

Presentation Slides – Overcoming Multicollinearity and Overfitting with Partial Least Squares Regression in JMP and SAS

My slides on partial least squares regression at the Toronto Area SAS Society (TASS) meeting on September 14, 2012, can be found here.

My Presentation on Partial Least Squares Regression

My first presentation to Toronto Area SAS Society (TASS) was delivered on September 14, 2012.  I introduced a supervised learning/predictive modelling technique called partial least squares (PLS) regression; I showed how normal linear least squares regression is often problematic when used with big data because of multicollinearity and overfitting, explained how partial least squares regression overcomes these limitations, and illustrated how to implement it in SAS and JMP.  I also highlighted the variable importance for projection (VIP) score that can be used to conduct variable selection with PLS regression; in particular, I documented its effectiveness as a technique for variable selection by comparing some key journal articles on this issue in academic literature.

overfitting

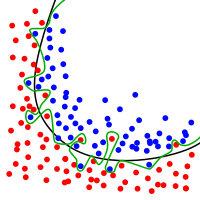
The green line is an overfitted classifier.  Not only does it model the underlying trend, but it also models the noise (the random variation) at the boundary.  It separates the blue and the red dots perfectly for this data set, but it will classify very poorly on a new data set from the same population.

Source: Chabacano via Wikimedia
Read more of this post

Presentation Slides – Finding Patterns in Data with K-Means Clustering in JMP and SAS

My slides on K-means clustering at the Toronto Area SAS Society (TASS) meeting on December 14, 2012, can be found here.

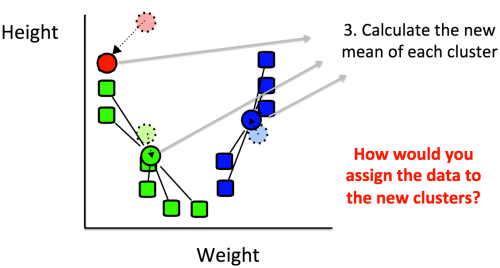
Screen Shot 2014-01-04 at 8.15.18 PM

This image is slightly enhanced from an image created by Weston.pace from Wikimedia Commons.

My Presentation on K-Means Clustering

I was very pleasured to be invited for the second time by the Toronto Area SAS Society (TASS) to deliver a presentation on machine learning.  (I previously presented on partial least squares regression.)  At its recent meeting on December 14, 2012, I introduced an unsupervised learning technique called K-means clustering.

I first defined clustering as a set of techniques for identifying groups of objects by maximizing a similarity criterion or, equivalently, minimizing a dissimilarity criterion.  I then defined K-means clustering specifically as a clustering technique that uses Euclidean proximity to a group mean as its similarity criterion.  I illustrated how this technique works with a simple 2-dimensional example; you can follow along this example in the slides by watching the sequence of images of the clusters toward convergence.  As with many other machine learning techniques, some arbitrary decisions need to be made to initiate the algorithm for K-means clustering:

  1. How many clusters should there be?
  2. What is the mean of each cluster?

I provided some guidelines on how to make these decisions in these slides.

Read more of this post

Displaying Isotopic Abundance Percentages with Bar Charts and Pie Charts

The Structure of an Atom

An atom consists of a nucleus at the centre and electrons moving around it.  The nucleus contains a mixture of protons and neutrons.  For most purposes in chemistry, the two most important properties about these 3 types of particles are their masses and charges.  In terms of charge, protons are positive, electrons are negative, and neutrons are neutral.  A proton’s mass is roughly the same as a neutron’s mass, but a proton is almost 2,000 times heavier than an electron.

lithium atom

This image shows a lithium atom, which has 3 electrons, 3 protons, and 4 neutrons.  

Source: Wikimedia Commons

Read more of this post