Exploratory Data Analysis: Quantile-Quantile Plots for New York’s Ozone Pollution Data
September 22, 2013 3 Comments
Introduction
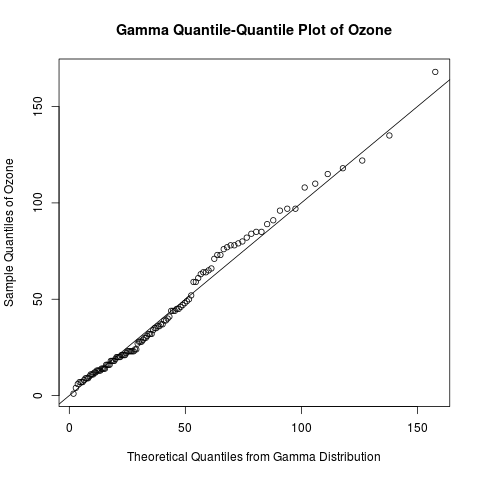
Continuing my recent series on exploratory data analysis, today’s post focuses on quantile-quantile (Q-Q) plots, which are very useful plots for assessing how closely a data set fits a particular distribution. I will discuss how Q-Q plots are constructed and use Q-Q plots to assess the distribution of the “Ozone” data from the built-in “airquality” data set in R.
Previous posts in this series on EDA include
- Descriptive statistics
- Box plots
- The conceptual foundations of kernel density estimation
- How to construct kernel density plots and rug plots in R
- Violin plots
- The conceptual foundations of empirical cumulative distribution functions (CDFs)
- 2 ways of plotting empirical CDFs in R
- Conceptual foundations of histograms and how to plot them in R
- Combining histograms and density plots in R
- The 5-number summary: Differences between fivenum() and summary() in R
- Useful R Functions for Exploring a Data Frame
Learn how to create a quantile-quantile plot like this one with R code in the rest of this blog!

Recent Comments