Analytical Chemistry Lesson of the Day – Accuracy in Method Validation and Quality Assurance

In pharmaceutical chemistry, one of the requirements for method validation is accuracy, the ability of an analytical method to obtain a value of a measurement that is close to the true value. There are several ways of assessing an analytical method for accuracy.

  1. Compare the value from your analytical method with an established or reference method.
  2. Use your analytical method to obtain a measurement from a sample with a known quantity (i.e. a reference material), and compare the measured value with the true value.
  3. If you don’t have a reference material for the second way, you can make your own by spiking a blank matrix with a measured quantity of the analyte.
  4. If your matrix may interfere with the analytical signal, then you cannot spike a blank matrix as described in the third way.  Instead, spike your sample with an known quantity of the standard.  I elaborate on this in a separate tutorial on standard addition, a common technique in analytical chemistry for determining the quantity of a substance when matrix interference exists.  Standard addition is an example of the second way of assessing accuracy as I mentioned above.  You can view the original post of this tutorial on the official JMP blog.
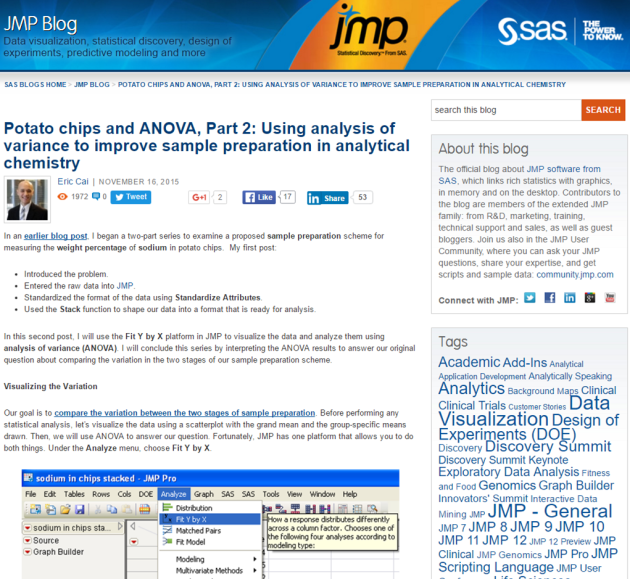
Potato Chips and ANOVA, Part 2: Using Analysis of Variance to Improve Sample Preparation in Analytical Chemistry

In this second article of a 2-part series on the official JMP blog, I use analysis of variance (ANOVA) to assess a sample-preparation scheme for quantifying sodium in potato chips.  I illustrate the use of the “Fit Y by X” platform in JMP to implement ANOVA, and I propose an alternative sample-preparation scheme to obtain a sample with a smaller variance.  This article is entitled “Potato Chips and ANOVA, Part 2: Using Analysis of Variance to Improve Sample Preparation in Analytical Chemistry“.

If you haven’t read my first blog post in this series on preparing the data in JMP and using the “Stack Columns” function to transpose data from wide format to long format, check it out!  I presented this topic at the last Vancouver SAS User Group (VanSUG) meeting on Wednesday, November 4, 2015.

My thanks to Arati Mejdal, Louis Valente, and Mark Bailey at JMP for their guidance in writing this 2-part series!  It is a pleasure to be a guest blogger for JMP!


potato-chips-and-analytical-chemistry-part-2

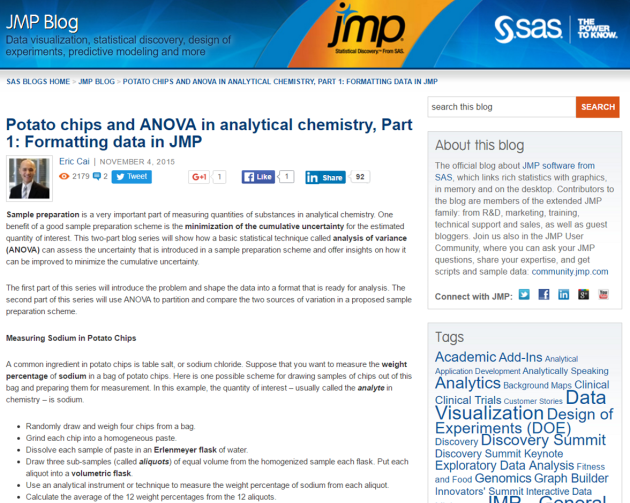
Potato Chips and ANOVA in Analytical Chemistry – Part 1: Formatting Data in JMP

I am very excited to write again for the official JMP blog as a guest blogger!  Today, the first article of a 2-part series has been published, and it is called “Potato Chips and ANOVA in Analytical Chemistry – Part 1: Formatting Data in JMP“.  This series of blog posts will talk about analysis of variance (ANOVA), sampling, and analytical chemistry, and it uses the quantification of sodium in potato chips as an example to illustrate these concepts.

The first part of this series discusses how to import the data into the JMP and prepare them for ANOVA.  Specifically, it illustrates how the “Stack Columns” function is used to transpose the data from wide format to long format.

I will present this at the Vancouver SAS User Group (VanSUG) meeting later today.

Stay tuned for “Part 2: Using Analysis of Variance to Improve Sample Preparation in Analytical Chemistry“!


potato-chips-and-analytical-chemistry-part-1

Analytical Chemistry Lesson of the Day – Linearity in Method Validation and Quality Assurance

In analytical chemistry, the quantity of interest is often estimated from a calibration line.  A technique or instrument generates the analytical response for the quantity of interest, so a calibration line is constructed from generating multiple responses from multiple standard samples of known quantities.  Linearity refers to how well a plot of the analytical response versus the quantity of interest follows a straight line.  If this relationship holds, then an analytical response can be generated from a sample containing an unknown quantity, and the calibration line can be used to estimate the unknown quantity with a confidence interval.

Note that this concept of “linear” is different from the “linear” in “linear regression” in statistics.

This is the the second blog post in a series of Chemistry Lessons of the Day on method validation in analytical chemistry.  Read the previous post on specificity, and stay tuned for future posts!

Analytical Chemistry Lesson of the Day – Specificity in Method Validation and Quality Assurance

In pharmaceutical chemistry, one of the requirements for method validation is specificity, the ability of an analytical method to distinguish the analyte from other chemicals in the sample.  The specificity of the method may be assessed by deliberately adding impurities into a sample containing the analyte and testing how well the method can identify the analyte.

Statistics is an important tool in analytical chemistry, and, ideally, there is no overlap in the vocabulary that is used between the 2 fields.  Unfortunately, the above definition of specificity is different from that in statistics.  In a previous Machine Learning and Applied Statistics Lesson of the Day, I introduced the concepts of sensitivity and specificity in binary classification.  In the context of assessing the predictive accuracy of a binary classifier, its specificity is the proportion of truly negative cases among the classified negative cases.

Analytical Chemistry Lesson of the Day – Method Validation in Quality Assurance

When developing any method in analytical chemistry, it must meet several criteria to ensure that it accomplishes its intended objective at or above an acceptable standard.  This process is called method validation, and it has the following criteria* in the pharmaceutical industry:

  • specificity
  • linearity
  • accuracy
  • precision
  • range
  • limit of detection
  • limit of quantitation
  • robustness**

As I will note in future Chemistry Lessons of the Day, these words are used differently between statistics and chemistry.

*These criteria are taken from Page 723 of the 6th edition of “Quantitative Chemical Analysis” by Daniel C. Harris (2003).

**The Food and Drug Administration does not list robustness as a typical characteristic of method validation.  (See Section B on Page 7 of its “Guidance for Industry Analytical Procedures and Methods Validation for Drugs and Biologics“.)  However, it does mention robustness several times as an important characteristic that “should be evaluated” during the “early stages of method development”.  

Organic and Inorganic Chemistry Lesson of the Day – Optical Rotation is a Bulk Property

It is important to note that optical rotation is usually discussed as a bulk property, because it’s usually measured as a bulk property by a polarimeter.  Any individual enantiomeric molecule can almost certainly rotate linearly polarized light.  However, in a bulk sample of a chiral substance, there is usually another molecule that can rotate light in the opposite direction.  This is due to the uniform distribution of the stereochemistry of a random sample of the molecules of one compound.  (In other words, the substance consists of different stereoisomers of one compound, and the proportions of the different stereoisomers are roughly equal.)  Because one molecule’s rotation of the light can be cancelled by another molecule’s optical rotation in the opposite direction, such a random sample of the compound would have no net optical rotation.  This type of cancellation will definitely occur in a racemic mixture.  However, if a substance is enantiomerically pure, then all of the molecules in that substance will rotate linearly polarized light in the same direction – this substance is optically active.

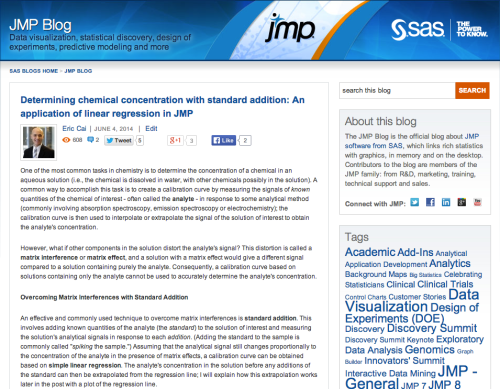
Determining chemical concentration with standard addition: An application of linear regression in JMP – A Guest Blog Post for the JMP Blog

I am very excited to announce that I have been invited by JMP to be a guest blogger for its official blog!  My thanks to Arati Mejdal, Global Social Media Manager for the JMP Division of SAS, for welcoming me into the JMP blogging community with so much support and encouragement, and I am pleased to publish my first post on the JMP Blog!  Mark Bailey and Byron Wingerd from JMP provided some valuable feedback to this blog post, and I am fortunate to get the chance to work with and learn from them!

Following the tradition of The Chemical Statistician, this post combines my passions for statistics and chemistry by illustrating how simple linear regression can be used for the method of standard addition in analytical chemistry.  In particular, I highlight the useful capability of the “Inverse Prediction” function under “Fit Model” platform in JMP to estimate the predictor given an observed response value (i.e. estimate the value of x_i given y_i).  Check it out!

JMP blog post - standard addition

Discovering Argon with the 2-Sample t-Test

I learned about Lord Rayleigh’s discovery of argon in my 2nd-year analytical chemistry class while reading “Quantitative Chemical Analysis” by Daniel Harris.  (William Ramsay was also responsible for this discovery.)  This is one of my favourite stories in chemistry; it illustrates how diligence in measurement can lead to an elegant and surprising discovery.  I find no evidence that Rayleigh and Ramsay used statistics to confirm their findings; their paper was published 13 years before Gosset published about the t-test.  Thus, I will use a 2-sample t-test in R to confirm their result.

Lord Rayleigh                                    William Ramsay

Photos of Lord Rayleigh and William Ramsay

Source: Wikimedia Commons

Read more of this post