Eric’s Enlightenment for Wednesday, April 22, 2015

  1. Frances Woolley’s useful reading list on tax policy for Canadians with disabilities
  2. Jeff Rosenthal asked a seemingly simple yet subtle question about uncorrelated normal random variables.
  3. A great catalogue of colours with their names in R – very useful for data visualization!
  4. Paul Crutzen’s proposed scheme to inject sulfur dioxide into the stratosphere – this would create sulfate aerosols for deflecting sunlight to counteract global warming, but he carefully weighed the serious pros and cons of this risky scheme.

Using PROC SGPLOT to Produce Box Plots with Contrasting Colours in SAS

I previously explained the statistics behind box plots and how to produce them in R in a very detailed tutorial.  I also illustrated how to produce side-by-side box plots with contrasting patterns in R.

Here is an example of how to make box plots in SAS using the VBOX statement in PROC SGPLOT.  I modified the built-in data set SASHELP.CLASS to generate one that suits my needs.

The PROC TEMPLATE statement specifies the contrasting colours to be used for different classes.  I also include code for exportingthe result into a PDF file using ODS PDF.  (I used varying shades of grey to allow the contrast to be shown when printed in black and white.)

boxplots

Read more of this post

Visual index of plots and corresponding R scripts

Dear Readers of The Chemical Statistician,

Joanna Zhao, an undergraduate researcher in the Department of Statistics at the University of British Columbia, produced a visual index of over 100 plots using ggplot2, the R package written by Hadley Wickham.

An example of a plot and its source R code on Joanna Zhao's catalogue.

An example of a plot and its source R code on Joanna Zhao’s catalog.

Click on a thumbnail of any picture in this catalog – you will see the figure AND all of the necessary code to reproduce it.  These plots are from Naomi Robbins‘ book “Creating More Effective Graphs”.

If you

  • want to produce an effective plot in R
  • roughly know what the plot should look like
  • but could really use an example to get started,

then this is a great resource for you!  A related GitHub repository has the code for ALL figures and the infrastructure for Joanna’s Shiny app.

I learned about this resource while working in my job at the British Columbia Cancer Agency; I am fortunate to attend a wonderful seminar series on statistics at the British Columbia Centre for Disease Control, and a colleague from this seminar told me about it.  By sharing this with you, I hope that it will immensely help you with your data visualization needs!

Trapezoidal Integration – Conceptual Foundations and a Statistical Application in R

Introduction

Today, I will begin a series of posts on numerical integration, which has a wide range of applications in many fields, including statistics.  I will introduce trapezoidal integration by discussing its conceptual foundations, write my own R function to implement trapezoidal integration, and use it to check that the Beta(2, 5) probability density function actually integrates to 1 over its support set.  Fully commented and readily usable R code will be provided at the end.

beta pdf

Given a probability density function (PDF) and its support set as vectors in an array programming language like R, how do you integrate the PDF over its support set to ensure that it equals to 1?  Read the rest of this post to view my own R function to implement trapezoidal integration and learn how to use it to numerically approximate integrals.

Read more of this post

Detecting Unfair Dice in Casinos with Bayes’ Theorem

Introduction

I saw an interesting problem that requires Bayes’ Theorem and some simple R programming while reading a bioinformatics textbook.  I will discuss the math behind solving this problem in detail, and I will illustrate some very useful plotting functions to generate a plot from R that visualizes the solution effectively.

The Problem

The following question is a slightly modified version of Exercise #1.2 on Page 8 in “Biological Sequence Analysis” by Durbin, Eddy, Krogh and Mitchison.

An occasionally dishonest casino uses 2 types of dice.  Of its dice, 97% are fair but 3% are unfair, and a “five” comes up 35% of the time for these unfair dice.  If you pick a die randomly and roll it, how many “fives”  in a row would you need to see before it was most likely that you had picked an unfair die?”

Read more to learn how to create the following plot and how it invokes Bayes’ Theorem to solve the above problem!

unfair die plot

Read more of this post

Exploratory Data Analysis: Combining Histograms and Density Plots to Examine the Distribution of the Ozone Pollution Data from New York in R

Introduction

This is a follow-up post to my recent introduction of histograms.  Previously, I presented the conceptual foundations of histograms and used a histogram to approximate the distribution of the “Ozone” data from the built-in data set “airquality” in R.  Today, I will examine this distribution in more detail by overlaying the histogram with parametric and non-parametric kernel density plots.  I will finally answer the question that I have asked (and hinted to answer) several times: Are the “Ozone” data normally distributed, or is another distribution more suitable?

histogram and kernel density plot

Read the rest of this post to learn how to combine histograms with density curves like this above plot!

This is another post in my continuing series on exploratory data analysis (EDA).  Previous posts in this series on EDA include

Read more of this post

Exploratory Data Analysis: Conceptual Foundations of Histograms – Illustrated with New York’s Ozone Pollution Data

Introduction

Continuing my recent series on exploratory data analysis (EDA), today’s post focuses on histograms, which are very useful plots for visualizing the distribution of a data set.  I will discuss how histograms are constructed and use histograms to assess the distribution of the “Ozone” data from the built-in “airquality” data set in R.  In a later post, I will assess the distribution of the “Ozone” data in greater depth by combining histograms with various types of density plots.

Previous posts in this series on EDA include

histogram

Read the rest of this post to learn how to construct a histogram and get the R code for producing the above plot!

Read more of this post

Exploratory Data Analysis – Kernel Density Estimation and Rug Plots in R on Ozone Data in New York and Ozonopolis

Update on July 15, 2013:

Thanks to Harlan Nelson for noting on AnalyticBridge that the ozone concentrations for both New York and Ozonopolis are non-negative quantities, so their kernel density plot should have non-negative support sets.  This has been corrected in this post by

– defining new variables called max.ozone and max.ozone2

– using the options “from = 0” and “to = max.ozone” or “to = max.ozone2” in the density() function when defining density.ozone and density.ozone2 in the R code.

Update on February 2, 2014:

Harlan also noted in the above comment that any truncated kernel density estimator (KDE) from density() in R does not integrate to 1 over its support set.  Thanks to Julian Richer Daily for suggesting on AnalyticBridge to scale any truncated kernel density estimator (KDE) from density() by its integral to get a KDE that integrates to 1 over its support set.  I have used my own function for trapezoidal integration to do so, and this has been added below.

I thank everyone for your patience while I took the time to write a post about numerical integration before posting this correction.  I was in the process of moving between jobs and cities when Harlan first brought this issue to my attention, and I had also been planning a major expansion of this blog since then.  I am glad that I have finally started a series on numerical integration to provide the conceptual background for the correction of this error, and I hope that they are helpful.  I recognize that this is a rather late correction, and I apologize for any confusion.

For the sake of brevity, this post has been created from the second half of a previous long post on kernel density estimation.  This second half focuses on constructing kernel density plots and rug plots in R.  The first half focused on the conceptual foundations of kernel density estimation.

Introduction

This post follows the recent introduction of the conceptual foundations of kernel density estimation.  It uses the “Ozone” data from the built-in “airquality” data set in R and the previously simulated ozone data for the fictitious city of “Ozonopolis” to illustrate how to construct kernel density plots in R.  It also introduces rug plots, shows how they can complement kernel density plots, and shows how to construct them in R.

This is another post in a recent series on exploratory data analysis, which has included posts on descriptive statistics, box plots, violin plots, the conceptual foundations of empirical cumulative distribution functions (CDFs), and how to plot empirical CDFs in R.

kernel density plot with rug plot ozone New York

Read the rest of this post to learn how to create the above combination of a kernel density plot and a rug plot!

Read more of this post

Exploratory Data Analysis: 2 Ways of Plotting Empirical Cumulative Distribution Functions in R

Introduction

Continuing my recent series on exploratory data analysis (EDA), and following up on the last post on the conceptual foundations of empirical cumulative distribution functions (CDFs), this post shows how to plot them in R.  (Previous posts in this series on EDA include descriptive statistics, box plots, kernel density estimation, and violin plots.)

I will plot empirical CDFs in 2 ways:

  1. using the built-in ecdf() and plot() functions in R
  2. calculating and plotting the cumulative probabilities against the ordered data

Continuing from the previous posts in this series on EDA, I will use the “Ozone” data from the built-in “airquality” data set in R.  Recall that this data set has missing values, and, just as before, this problem needs to be addressed when constructing plots of the empirical CDFs.

Recall the plot of the empirical CDF of random standard normal numbers in my earlier post on the conceptual foundations of empirical CDFs.  That plot will be compared to the plots of the empirical CDFs of the ozone data to check if they came from a normal distribution.

Read more of this post

Exploratory Data Analysis: Conceptual Foundations of Empirical Cumulative Distribution Functions

Introduction

Continuing my recent series on exploratory data analysis (EDA), this post focuses on the conceptual foundations of empirical cumulative distribution functions (CDFs); in a separate post, I will show how to plot them in R.  (Previous posts in this series include descriptive statistics, box plots, kernel density estimation, and violin plots.)

To give you a sense of what an empirical CDF looks like, here is an example created from 100 randomly generated numbers from the standard normal distribution.  The ecdf() function in R was used to generate this plot; the entire code is provided at the end of this post, but read my next post for more detail on how to generate plots of empirical CDFs in R.

ecdf standard normal

Read to rest of this post to learn what an empirical CDF is and how to produce the above plot!

Read more of this post

Exploratory Data Analysis: Combining Box Plots and Kernel Density Plots into Violin Plots for Ozone Pollution Data

Introduction

Recently, I began a series on exploratory data analysis (EDA), and I have written about descriptive statistics, box plots, and kernel density plots so far.  As previously mentioned in my post on box plots, there is a way to combine box plots and kernel density plots.  This combination results in violin plots, and I will show how to create them in R today.

Continuing from my previous posts on EDA, I will use 2 univariate data sets.  One is the “ozone” data vector that is part of the “airquality” data set that is built into R; this data set contains data on New York’s air pollution.  The other is a simulated data set of ozone pollution in a fictitious city called “Ozonopolis”.  It is important to remember that the ozone data from New York has missing values, and this has created complications that needed to be addressed in previous posts; missing values need to be addressed for violin plots, too, and in a different way than before.  

The vioplot() command in the “vioplot” package creates violin plots; the plotting options in this function are different and less versatile than other plotting functions that I have used in R.  Thus, I needed to be more creative with the plot(), title(), and axis() functions to create the plots that I want.  Read the details carefully to understand and benefit fully from the code.

violin plots

Read further to learn how to create these violin plots that combine box plots with kernel density plots!  Be careful – the syntax is more complicated than usual!

Read more of this post

Exploratory Data Analysis: Kernel Density Estimation – Conceptual Foundations

For the sake of brevity, this post has been created from the first half of a previous long post on kernel density estimation.  This first half focuses on the conceptual foundations of kernel density estimationThe second half will focus on constructing kernel density plots and rug plots in R.

Introduction

Recently, I began a series on exploratory data analysis; so far, I have written about computing descriptive statistics and creating box plots in R for a univariate data set with missing values.  Today, I will continue this series by introducing the underlying concepts of kernel density estimation, a useful non-parametric technique for visualizing the underlying distribution of a continuous variable.  In the follow-up post, I will show how to construct kernel density estimates and plot them in R.  I will also introduce rug plots and show how they can complement kernel density plots.


kernel density plot ozone


But first – read the rest of this post to learn the conceptual foundations of kernel density estimation.

Read more of this post

Exploratory Data Analysis: Variations of Box Plots in R for Ozone Concentrations in New York City and Ozonopolis

Introduction

Last week, I wrote the first post in a series on exploratory data analysis (EDA).  I began by calculating summary statistics on a univariate data set of ozone concentration in New York City in the built-in data set “airquality” in R.  In particular, I talked about how to calculate those statistics when the data set has missing values.  Today, I continue this series by creating box plots in R and showing different variations and extensions that can be added; be sure to examine the details of this post’s R code for some valuable details.  I learned many of these tricks from Robert Kabacoff’s “R in Action” (2011).  Robert also has a nice blog called Quick-R that I consult often.

Recall that I the “Ozone” vector in the data set “airquality” has missing values.  Let’s remove those missing values first before constructing the box plots.

# abstract the raw data vector
ozone0 = airquality$Ozone

# remove the missing values
ozone = ozone0[!is.na(ozone)] 

Box Plots – What They Represent

The simplest box plot can be obtained by using the basic settings in the boxplot() command.  As usual, I use png() and dev.off() to print the image to a local folder on my computer.

png('INSERT YOUR DIRECTORY HERE/box plot ozone.png')
boxplot(ozone, ylab = 'Ozone (ppb)', main = 'Box Plot of Ozone in New York')
dev.off()

box plot ozone

What do the different parts of this box plot mean?

Read more of this post

When Does the Kinetic Theory of Gases Fail? Examining its Postulates with Assistance from Simple Linear Regression in R

Introduction

The Ideal Gas Law, \text{PV} = \text{nRT} , is a very simple yet useful relationship that describes the behaviours of many gases pretty well in many situations.  It is “Ideal” because it makes some assumptions about gas particles that make the math and the physics easy to work with; in fact, the simplicity that arises from these assumptions allows the Ideal Gas Law to be easily derived from the kinetic theory of gases.  However, there are situations in which those assumptions are not valid, and, hence, the Ideal Gas Law fails.

Boyle’s law is inherently a part of the Ideal Gas Law.  It states that, at a given temperature, the pressure of an ideal gas is inversely proportional to its volume.  Equivalently, it states the product of the pressure and the volume of an ideal gas is a constant at a given temperature.

\text{P} \propto \text{V}^{-1}

An Example of The Failure of the Ideal Gas Law

This law is valid for many gases in many situations, but consider the following data on the pressure and volume of 1.000 g of oxygen at 0 degrees Celsius.  I found this data set in Chapter 5.2 of “General Chemistry” by Darrell Ebbing and Steven Gammon.

               Pressure (atm)      Volume (L)              Pressure X Volume (atm*L)
[1,]           0.25                2.8010                  0.700250
[2,]           0.50                1.4000                  0.700000
[3,]           0.75                0.9333                  0.699975
[4,]           1.00                0.6998                  0.699800
[5,]           2.00                0.3495                  0.699000
[6,]           3.00                0.2328                  0.698400
[7,]           4.00                0.1744                  0.697600
[8,]           5.00                0.1394                  0.697000

The right-most column is the product of pressure and temperature, and it is not constant.  However, are the differences between these values significant, or could it be due to some random variation (perhaps round-off error)?

Here is the scatter plot of the pressure-volume product with respect to pressure.

scatter plot pv vs pressure

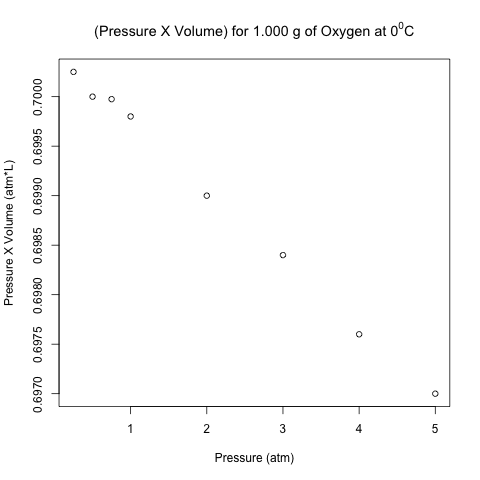
These points don’t look like they are on a horizontal line!  Let’s analyze these data using normal linear least-squares regression in R.

Read more of this post

Using the Golden Section Search Method to Minimize the Sum of Absolute Deviations

Introduction

Recently, I introduced the golden search method – a special way to save computation time by modifying the bisection method with the golden ratio – and I illustrated how to minimize a cusped function with this script.  I also wrote an R function to implement this method and an R script to apply this method with an example.  Today, I will use apply this method to a statistical topic: minimizing the sum of absolute deviations with the median.

While reading Page 148 (Section 6.3) in Michael Trosset’s “An Introduction to Statistical Inference and Its Applications”, I learned 2 basic, simple, yet interesting theorems.

If X is a random variable with a population mean \mu and a population median q_2, then

a) \mu minimizes the function f(c) = E[(X - c)^2]

b) q_2 minimizes the function h(c) = E(|X - c|)

I won’t prove these theorems in this blog post (perhaps later), but I want to use the golden section search method to show a result similar to b):

c) The sample median, \tilde{m} , minimizes the function

g(c) = \sum_{i=1}^{n} |X_i - c|.

This is not surprising, of course, since

|X - c| is just a function of the random variable X

– by the law of large numbers,

\lim_{n\to \infty}\sum_{i=1}^{n} |X_i - c| = E(|X - c|)

Thus, if the median minimizes E(|X - c|), then, intuitively, it minimizes \lim_{n\to \infty}\sum_{i=1}^{n} |X_i - c|.  Let’s show this with the golden section search method, and let’s explore any differences that may arise between odd-numbered and even-numbered data sets.

Read more of this post

Checking the Goodness of Fit of the Poisson Distribution in R for Alpha Decay by Americium-241

Introduction

Today, I will discuss the alpha decay of americium-241 and use R to model the number of emissions from a real data set with the Poisson distribution.  I was especially intrigued in learning about the use of Am-241 in smoke detectors, and I will elaborate on this clever application.  I will then use the Pearson chi-squared test to check the goodness of fit of my model.  The R script for the full analysis is given at the end of the post; there is a particularly useful code for superscripting the mass number of a chemical isotope in the title of a plot.  While there are many examples of superscripts in plot titles and axes that can be found on the web, none showed how to put the superscript before a text.  I hope that this and other tricks in this script are of use to you.

smoke detector


Smoke Detector with Americium-241

Source: Creative Commons via Eric Mason’s Coursework for Physics 241 at Stanford University

Read more of this post

How do Dew and Fog Form? Nature at Work with Temperature, Vapour Pressure, and Partial Pressure

In the early morning, especially here in Canada, I often see dew – water droplets formed by the condensation of water vapour on outside surfaces, like windows, car roofs, and leaves of trees.  I also sometimes see fog – water droplets or ice crystals that are suspended in air and often blocking visibility at great distances.  Have you ever wondered how they form?  It turns out that partial pressure, vapour pressure and temperature are the key phenomena at work.

dew fog

Dew (by Staffan Enbom) and Fog (by Jon Zander)

Source: Wikimedia

Read more of this post

Estimating the Decay Rate and the Half-Life of DDT in Trout – Applying Simple Linear Regression with Logarithmic Transformation

This blog post uses a function and a script written in R that were displayed in an earlier blog post.

Introduction

This is the second of a series of blog posts about simple linear regression; the first was written recently on some conceptual nuances and subtleties about this model.  In this blog post, I will use simple linear regression to analyze a data set with a logarithmic transformation and discuss how to make inferences on the regression coefficients and the means of the target on the original scale.  The data document the decay of dichlorodiphenyltrichloroethane (DDT) in trout in Lake Michigan; I found it on Page 49 in the book “Elements of Environmental Chemistry” by Ronald A. Hites.  Future posts will also be written on the chemical aspects of this topic, including the environmental chemistry of DDT and exponential decay in chemistry and, in particular, radiochemistry.

DDT

Dichlorodiphenyltrichloroethane (DDT)

Source: Wikimedia Commons


A serious student of statistics or a statistician re-learning the fundamentals like myself should always try to understand the math and the statistics behind a software’s built-in function rather than treating it like a black box.  This is especially worthwhile for a basic yet powerful tool like simple linear regression.  Thus, instead of simply using the lm() function in R, I will reproduce the calculations done by lm() with my own function and script (posted earlier on my blog) to obtain inferential statistics on the regression coefficients.  However, I will not write or explain the math behind the calculations; they are shown in my own function with very self-evident variable names, in case you are interested.  The calculations are arguably the most straightforward aspects of linear regression, and you can easily find the derivations and formulas on the web, in introductory or applied statistics textbooks, and in regression textbooks.

Read more of this post

Discovering Argon with the 2-Sample t-Test

I learned about Lord Rayleigh’s discovery of argon in my 2nd-year analytical chemistry class while reading “Quantitative Chemical Analysis” by Daniel Harris.  (William Ramsay was also responsible for this discovery.)  This is one of my favourite stories in chemistry; it illustrates how diligence in measurement can lead to an elegant and surprising discovery.  I find no evidence that Rayleigh and Ramsay used statistics to confirm their findings; their paper was published 13 years before Gosset published about the t-test.  Thus, I will use a 2-sample t-test in R to confirm their result.

Lord Rayleigh                                    William Ramsay

Photos of Lord Rayleigh and William Ramsay

Source: Wikimedia Commons

Read more of this post

Adding Labels to Points in a Scatter Plot in R

What’s the Scatter?

A scatter plot displays the values of 2 variables for a set of data, and it is a very useful way to visualize data during exploratory data analysis, especially (though not exclusively) when you are interested in the relationship between a predictor variable and a target variable.  Sometimes, such data come with categorical labels that have important meanings, and the visualization of the relationship can be enhanced when these labels are attached to the data.

It is common practice to use a legend to label data that belong to a group, as I illustrated in a previous post on bar charts and pie charts.  However, what if every datum has a unique label, and there are many data in the scatter plot?  A legend would add unnecessary clutter in such situations.  Instead, it would be useful to write the label of each datum near its point in the scatter plot. I will show how to do this in R, illustrating the code with a built-in data set called LifeCycleSavings.

Read more of this post