University of Toronto Statistical Sciences Union Career Panel

I am delighted to be invited to speak at the University of Toronto Statistical Sciences Union’s first ever Career Panel.  If you plan to attend this event, I encourage you to read my advice columns on career development in advance.  In particular, I strongly encourage you to read the blog post “How to Find a Job in Statistics – Advice for Students and Recent Graduates“.  I will not cover all of the topics in these columns, but you are welcomed to ask questions about them during the question-and-answer period.

Here are the event’s details.

Time: 1 pm to 6 pm

  • My session will be held from 5pm to 6 pm.

Date: Saturday, March 25, 2017

Location: Sidney Smith Hall, 100 St. George Street, Toronto, Ontario.

  • Sidney Smith Hall is located on the St. George (Downtown) campus of the University of Toronto.
  • Update: The seminars will be held in Rooms 2117 and 2118.  I will speak in Room 2117 at 5 pm.


If you will attend this event, please feel free to come and say “Hello”!

Potato Chips and ANOVA in Analytical Chemistry – Part 1: Formatting Data in JMP

I am very excited to write again for the official JMP blog as a guest blogger!  Today, the first article of a 2-part series has been published, and it is called “Potato Chips and ANOVA in Analytical Chemistry – Part 1: Formatting Data in JMP“.  This series of blog posts will talk about analysis of variance (ANOVA), sampling, and analytical chemistry, and it uses the quantification of sodium in potato chips as an example to illustrate these concepts.

The first part of this series discusses how to import the data into the JMP and prepare them for ANOVA.  Specifically, it illustrates how the “Stack Columns” function is used to transpose the data from wide format to long format.

I will present this at the Vancouver SAS User Group (VanSUG) meeting later today.

Stay tuned for “Part 2: Using Analysis of Variance to Improve Sample Preparation in Analytical Chemistry“!


potato-chips-and-analytical-chemistry-part-1

Odds and Probability: Commonly Misused Terms in Statistics – An Illustrative Example in Baseball

Yesterday, all 15 home teams in Major League Baseball won on the same day – the first such occurrence in history.  CTV News published an article written by Mike Fitzpatrick from The Associated Press that reported on this event.  The article states, “Viewing every game as a 50-50 proposition independent of all others, STATS figured the odds of a home sweep on a night with a full major league schedule was 1 in 32,768.”  (Emphases added)

odds of all 15 home teams winning on same day

Screenshot captured at 5:35 pm Vancouver time on Wednesday, August 12, 2015.

Out of curiosity, I wanted to reproduce this result.  This event is an intersection of 15 independent Bernoulli random variables, all with the probability of the home team winning being 0.5.

P[(\text{Winner}_1 = \text{Home Team}_1) \cap (\text{Winner}_2 = \text{Home Team}_2) \cap \ldots \cap (\text{Winner}_{15}= \text{Home Team}_{15})]

Since all 15 games are assumed to be mutually independent, the probability of all 15 home teams winning is just

P(\text{All 15 Home Teams Win}) = \prod_{n = 1}^{15} P(\text{Winner}_i = \text{Home Team}_i)

P(\text{All 15 Home Teams Win}) = 0.5^{15} = 0.00003051757

Now, let’s connect this probability to odds.

It is important to note that

  • odds is only applicable to Bernoulli random variables (i.e. binary events)
  • odds is the ratio of the probability of success to the probability of failure

For our example,

\text{Odds}(\text{All 15 Home Teams Win}) = P(\text{All 15 Home Teams Win}) \ \div \ P(\text{At least 1 Home Team Loses})

\text{Odds}(\text{All 15 Home Teams Win}) = 0.00003051757 \div (1 - 0.00003051757)

\text{Odds}(\text{All 15 Home Teams Win}) = 0.0000305185

The above article states that the odds is 1 in 32,768.  The fraction 1/32768 is equal to 0.00003051757, which is NOT the odds as I just calculated.  Instead, 0.00003051757 is the probability of all 15 home teams winning.  Thus, the article incorrectly states 0.00003051757 as the odds rather than the probability.

This is an example of a common confusion between probability and odds that the media and the general public often make.  Probability and odds are two different concepts and are calculated differently, and my calculations above illustrate their differences.  Thus, exercise caution when reading statements about probability and odds, and make sure that the communicator of such statements knows exactly how they are calculated and which one is more applicable.

Career Seminar at Department of Statistics and Actuarial Science, Simon Fraser University: 1:30 – 2:20 pm, Friday, February 20, 2015

I am very pleased to be invited to speak to the faculty and students in the Department of Statistics and Actuarial Science at Simon Fraser University on this upcoming Friday.  I look forward to sharing my career advice and answering questions from the students about how to succeed in a career in statistics.  If you will attend this seminar, please feel free to come and say “Hello”!

Eric Cai - Official Head Shot

Read more of this post

Using Your Vacation to Develop Your Career – Guest Blogging on Simon Fraser University’s Career Services Informer

The following post was originally published on the Career Services Informer.

I recently took a vacation from my former role as a statistician at the BC Centre for Excellence in HIV/AIDS. I did not plan a trip out of town – the spring weather was beautiful in Vancouver, and I wanted to spend time on the things that I like to do in this city. Many obvious things came to mind – walking along beaches, practicing Python programming and catching up with friends – just to name a few.

sfu csi

Yes, Python programming was one of the obvious things on my vacation to-do list, and I understand how ridiculous this may seem to some people. Why tax my brain during a time that is meant for mental relaxation, especially when the weather is great?

Read more of this post

Vancouver Machine Learning and Data Science Meetup – NLP to Find User Archetypes for Search & Matching

I will attend the following seminar by Thomas Levi in the next R/Machine Learning/Data Science Meetup in Vancouver on Wednesday, June 25.  If you will also attend this event, please come up and say “Hello”!  I would be glad to meet you!

Eric Cai - Official Head Shot

To register, sign up for an account on Meetup, and RSVP in the R Users Group, the Machine Learning group or the Data Science group.

     Title: NLP to Find User Archetypes for Search & Matching

     Speaker: Thomas Levi, Plenty of Fish

     Location: HootSuite, 5 East 8th Avenue, Vancouver, BC

     Time and Date: 6-8 pm, Wednesday, June 25, 2014


Abstract

As the world’s largest free dating site, Plenty Of Fish would like to be able to match with and allow users to search for people with similar interests. However, we allow our users to enter their interests as free text on their profiles. This presents a difficult problem in clustering, search and machine learning if we want to move beyond simple ‘exact match’ solutions to a deeper archetypal user profiling and thematic search system. Some of the common issues that arise are misspellings, synonyms (e.g. biking, cycling and bicycling) and similar interests (e.g. snowboarding and skiing) on a several million user scale. In this talk I will demonstrate how we built a system utilizing topic modelling with Latent Dirichlet Allocation (LDA) on a several hundred thousand word vocabulary over ten million+ North American users and explore its applications at POF.


Bio

Thomas Levi started out with a doctorate in Theoretical Physics and String Theory from the University of Pennsylvania in 2006. His post-doctoral studies in cosmology and string theory, where he wrote 19 papers garnering 650+ citations, then took him to NYU and finally UBC.  In 2012, he decided to move into industry, and took on the role of Senior Data Scientist at POF. Thomas has been involved in diverse projects such as behaviour analysis, social network analysis, scam detection, Bot detection, matching algorithms, topic modelling and semantic analysis.


Schedule
• 6:00PM Doors are open, feel free to mingle
• 6:30 Presentations start
• 8:00 Off to a nearby watering hole (Mr. Brownstone?) for a pint, food, and/or breakout discussions


How to Find a Job in Statistics – Advice for Students and Recent Graduates

Introduction

A graduate student in statistics recently asked me for advice on how to find a job in our industry.  I’m happy to share my advice about this, and I hope that my advice can help you to find a satisfying job and develop an enjoyable career.  My perspectives would be most useful to students and recent graduates because of my similar but unique background; I graduated only 1.5 years ago from my Master’s degree in statistics at the University of Toronto, and I volunteered as a career advisor at Simon Fraser University during my Bachelor’s degree.  My advice will reflect my experience in finding a job in Toronto, but you can probably find parallels in your own city.

Most of this post focuses on soft skills that are needed to find any job; I dive specifically into advice for statisticians in the last section.  Although the soft skills are general and not specific to statisticians, many employers, veteran statisticians, and professors have told me that students and recent graduates would benefit from the focus on soft skills.  Thus, I discuss them first and leave the statistics-specific advice till the end.

Read more of this post

Opening Doors In Your Job Search With Statistics & Data Analysis – Guest Blogging on Simon Fraser University’s Career Services Informer

The following post was originally published on the Career Services Informer.

Who are the potential customers that a company needs to target in its marketing campaign for a new service? What factors cause defects in a manufacturer’s production process? What impact does a wage-subsidy program have on alleviating poverty in a low-income neighbourhood? Despite the lack of any suggestion about numbers or data in any of these questions, statistics is increasingly playing a bigger – if not the biggest – role in answering them. These are also problems your next employer may need you to adress. How will you tackle them?

sfu csi

The information economy of the 21st century demands us to adapt to its emphasis on extracting insight from data – and data are exploding in size and complexity in all industries. As you transition from the classroom to the workplace in a tough job market, becoming proficient in basic statistics and data analysis will give you an edge in fields that involve working with information. This applies especially to STEM (science, technology, engineering, and mathematics) and business, but it also applies to health care, governmental affairs, and the social sciences. Even fields like law and the arts are relying on data for making key decisions.

Read more of this post

Don’t Take Good Data for Granted: A Caution for Statisticians

Background

Yesterday, I had the pleasure of attending my first Spring Alumni Reunion at the University of Toronto.  (I graduated from its Master of Science program in statistics in 2012.)  There were various events for the alumni: attend interesting lectures, find out about our school’s newest initiatives, and meet other alumni in smaller gatherings tailored for particular groups or interests.  The event was very well organized and executed, and I am very appreciative of my alma mater for working so hard to include us in our university’s community beyond graduation.  Most of the attendees graduated 20 or more years ago; I met quite a few who graduated in the 1950’s and 1960’s.  It was quite interesting to chat with them over lunch and during breaks to learn about what our school was like back then.  (Incidentally, I did not meet anyone who graduated in the last 2 years.)

A Thought-Provoking Lecture

My highlight at the reunion event was attending Joseph Wong‘s lecture on poverty, governmental welfare programs, developmental economics in poor countries, and social innovation.  (He is a political scientist at UToronto, and you can find videos of him discussing his ideas on Youtube.)  Here are a few of his key ideas that I took away; note that these are my interpretations of what I can remember from the lecture, so they are not transcriptions or even paraphrases of his exact words:

  1. Many workers around the world are not documented by official governmental records.  This is especially true in developing countries, where the nature of the employer-employee relationship (e.g. contractual work, temporary work, unreported labour) or the limitations of the survey/sampling methods make many of these “invisible workers” unrepresented.  Wong argues that this leads to inequitable distribution of welfare programs that aim to re-distribute wealth.
  2. Social innovation is harnessing knowledge to create an impact.  It often does NOT involve inventing a new technology, but actually combining, re-combining, or arranging existing knowledge and technologies to solve a social problem in an innovative way.  Wong addressed this in further detail in a recent U of T News article.
  3. Poor people will not automatically flock to take advantage of a useful product or service just because of a decrease in price.  Sometimes, substantial efforts and intelligence in marketing are needed to increase the quantity demanded.  A good example is the Tata Nano, a small car that was made and sold in India with huge expectations but underwhelming success.
  4. Poor people often need to mitigate a lot of risk, and that can have a significant and surprising effect on their behaviour in response to the availability of social innovations.  For example, a poor person may forgo a free medical treatment or diagnostic screening if he/she risks losing a job or a business opportunity by taking the time away from work to get that treatment/screening.  I asked him about the unrealistic assumptions that he often sees in economic models based on his field work, and he notes that absence of risk (e.g. in cost functions) as one such common unrealistic assumption.

The Importance of Checking the Quality of the Data

These are all very interesting points to me in their own right.  However, Point #1 is especially important to me as a statistician.  During my Master’s degree, I was warned that most data sets in practice are not immediately ready for analysis, and substantial data cleaning is needed before any analysis can be done; data cleaning can often take 80% of the total amount of time in a project.  I have seen examples of this in my job since finishing my graduate studies a little over a year ago, and I’m sure that I will see more of it in the future.

Even before cleaning the data, it is important to check how the data were collected.  If sampling or experimental methods were used, it is essential to check if they were used or designed properly.  It would be unsurprising to learn that many bureaucrats, policy makers, and elected officials have used unreliable labour statistics to guide all kinds of economic policies on business, investment, finance, welfare, and labour – let alone the other non-economic justifications and factors, like politics, that cloud and distort these policies even further.

We statisticians have a saying about data quality: “garbage in – garbage out”.  If the data are of poor quality, then any insights derived from analyzing those data are useless, regardless of how good the analysis or the modelling technique is.  As a statistician, I cannot take good data for granted, and I aim to be more vigilant about the quality and the source of the data before I begin to analyze them.

Spatial Statistics Seminar in Toronto – Tuesday, May 21, 2013 @ SAS Canada Headquarters

I volunteer with the Southern Ontario Regional Association (SORA) of the Statistical Society of Canada (SSC) to organize a seminar series on business analytics here in Toronto.  The final seminar of the 2012-2013 series will be held on Tuesday, May 21 at SAS Canada Headquarters.  If you’re interested in attending, please email seminar.sora@gmail.com with the following subject to get a confirmation: Registration: Seminar by BBM Canada 

Speakers: Derrick Gray and Ricardo Gomez-Insausti – BBM Canada 

Title: The Power of the Latitude and Longitude – An Application of Spatial Techniques to Audience Measurement Data

Date: Tuesday, May 21, 2013 


Location: 

SAS Headquarters Office 

Suite 500

280 King Street East

Toronto 


Networking: 2:00 – 2:30 pm 

Introductory Remarks: 2:30 – 2:45 pm 

Seminar Time: 2:45 – 3:45 pm 

Discussion and Networking: 3:45 – 5:00 pm 

Read the entire post to see the abstract and the speakers’ biographies.

Read more of this post

Webinar – Advanced Predictive Modelling for Manufacturing

The company that I work for, Predictum, is about to begin a free webinar series on statistics and analytics, and I will present the first one on Tuesday, May 14, at 2 pm EDT.  This first webinar will focus on how partial least squares regression can be used as a predictive modelling technique; the data sets are written in the context of manufacturing, but it is definitely to all industries that need techniques beyond basic statistical tools like linear regression for predictive modelling.  JMP, a software that Predictum uses extensively, will be used to illustrate how partial least squares regression can be implemented.  This presentation will not be heavy in mathematical detail, so it will be accessible to a wide audience, including statisticians, analysts, managers, and executives. 

Eric Cai - Official Head Shot

Attend my company’s free webinar to listen to me talking about advanced predictive modelling and partial least squares regression!

To register for this free webinar, visit the webinar’s registration page on Webex.

Presentation Slides: Machine Learning, Predictive Modelling, and Pattern Recognition in Business Analytics

I recently delivered a presentation entitled “Using Advanced Predictive Modelling and Pattern Recognition in Business Analytics” at the Statistical Society of Canada’s (SSC’s) Southern Ontario Regional Association (SORA) Business Analytics Seminar Series.  In this presentation, I

– discussed how traditional statistical techniques often fail in analyzing large data sets

– defined and described machine learning, supervised learning, unsupervised learning, and the many classes of techniques within these fields, as well as common examples in business analytics to illustrate these concepts

– introduced partial least squares regression and bootstrap forest (or random forest) as two examples of supervised learning (0r predictive modelling) techniques that can effectively overcome the common failures of traditional statistical techniques and can be easily implemented in JMP

– illustrated how partial least squares regression and bootstrap forest were successfully used to solve some major problems for 2 different clients at Predictum, where I currently work as a statistician

Read more of this post

Presentation Slides – Overcoming Multicollinearity and Overfitting with Partial Least Squares Regression in JMP and SAS

My slides on partial least squares regression at the Toronto Area SAS Society (TASS) meeting on September 14, 2012, can be found here.

My Presentation on Partial Least Squares Regression

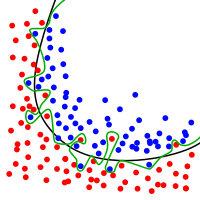
My first presentation to Toronto Area SAS Society (TASS) was delivered on September 14, 2012.  I introduced a supervised learning/predictive modelling technique called partial least squares (PLS) regression; I showed how normal linear least squares regression is often problematic when used with big data because of multicollinearity and overfitting, explained how partial least squares regression overcomes these limitations, and illustrated how to implement it in SAS and JMP.  I also highlighted the variable importance for projection (VIP) score that can be used to conduct variable selection with PLS regression; in particular, I documented its effectiveness as a technique for variable selection by comparing some key journal articles on this issue in academic literature.

overfitting

The green line is an overfitted classifier.  Not only does it model the underlying trend, but it also models the noise (the random variation) at the boundary.  It separates the blue and the red dots perfectly for this data set, but it will classify very poorly on a new data set from the same population.

Source: Chabacano via Wikimedia
Read more of this post