Store multiple strings of text as a macro variable in SAS with PROC SQL and the INTO statement

I often need to work with many variables at a time in SAS, but I don’t like to type all of their names manually – not only is it messy to read, it also induces errors in transcription, even when copying and pasting.  I recently learned of an elegant and efficient way to store multiple variable names into a macro variable that overcomes those problems.  This technique uses the INTO statement in PROC SQL.

To illustrate how this storage method can be applied in a practical context, suppose that we want to determine the factors that contribute to a baseball player’s salary in the built-in SASHELP.BASEBALL data setI will consider all continuous variables other than “Salary” and “logSalary”, but I don’t want to write them explicitly in any programming statements.  To do this, I first obtain the variable names and types of a data set using PROC CONTENTS.

* create a data set of the variable names;
proc contents
     data = sashelp.baseball
          noprint
     out = bvars (keep = name type);
run;
Read more of this post

Sorting correlation coefficients by their magnitudes in a SAS macro

Theoretical Background

Many statisticians and data scientists use the correlation coefficient to study the relationship between 2 variables.  For 2 random variables, X and Y, the correlation coefficient between them is defined as their covariance scaled by the product of their standard deviations.  Algebraically, this can be expressed as

\rho_{X, Y} = \frac{Cov(X, Y)}{\sigma_X \sigma_Y} = \frac{E[(X - \mu_X)(Y - \mu_Y)]}{\sigma_X \sigma_Y}.

In real life, you can never know what the true correlation coefficient is, but you can estimate it from data.  The most common estimator for \rho is the Pearson correlation coefficient, which is defined as the sample covariance between X and Y divided by the product of their sample standard deviations.  Since there is a common factor of

\frac{1}{n - 1}

in the numerator and the denominator, they cancel out each other, so the formula simplifies to

r_P = \frac{\sum_{i = 1}^{n}(x_i - \bar{x})(y_i - \bar{y})}{\sqrt{\sum_{i = 1}^{n}(x_i - \bar{x})^2 \sum_{i = 1}^{n}(y_i - \bar{y})^2}} .


In predictive modelling, you may want to find the covariates that are most correlated with the response variable before building a regression model.  You can do this by

  1. computing the correlation coefficients
  2. obtaining their absolute values
  3. sorting them by their absolute values.

Read more of this post

Eric’s Enlightenment for Wednesday, April 22, 2015

  1. Frances Woolley’s useful reading list on tax policy for Canadians with disabilities
  2. Jeff Rosenthal asked a seemingly simple yet subtle question about uncorrelated normal random variables.
  3. A great catalogue of colours with their names in R – very useful for data visualization!
  4. Paul Crutzen’s proposed scheme to inject sulfur dioxide into the stratosphere – this would create sulfate aerosols for deflecting sunlight to counteract global warming, but he carefully weighed the serious pros and cons of this risky scheme.

How to Calculate a Partial Correlation Coefficient in R: An Example with Oxidizing Ammonia to Make Nitric Acid

Introduction

Today, I will talk about the math behind calculating partial correlation and illustrate the computation in R.  The computation uses an example involving the oxidation of ammonia to make nitric acid, and this example comes from a built-in data set in R called stackloss.

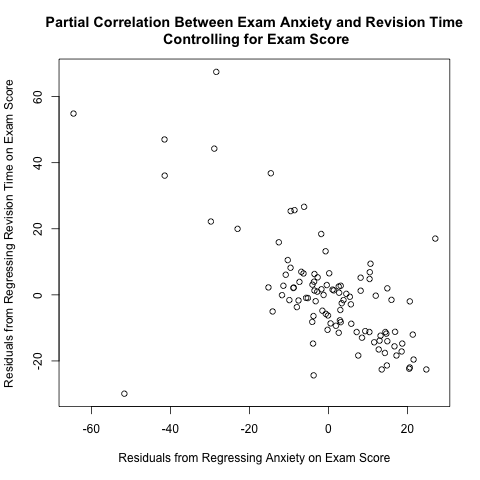
I read Pages 234-237 in Section 6.6 of “Discovering Statistics Using R” by Andy Field, Jeremy Miles, and Zoe Field to learn about partial correlation.  They used a data set called “Exam Anxiety.dat” available from their companion web site (look under “6 Correlation”) to illustrate this concept; they calculated the partial correlation coefficient between exam anxiety and revision time while controlling for exam score.  As I discuss further below, the plot between the 2 above residuals helps to illustrate the calculation of partial correlation coefficients.  This plot makes intuitive sense; if you take more time to study for an exam, you tend to have less exam anxiety, so there is a negative correlation between revision time and exam anxiety.

residuals plot anxiety and revision time controlling exam score

They used a function called pcor() in a package called “ggm”; however, I suspect that this package is no longer working properly, because it depends on a deprecated package called “RBGL” (i.e. “RBGL” is no longer available in CRAN).  See this discussion thread for further information.  Thus, I wrote my own R function to illustrate partial correlation.

Partial correlation is the correlation between 2 random variables while holding other variables constant.  To calculate the partial correlation between X and Y while holding Z constant (or controlling for the effect of Z, or averaging out Z),

Read more of this post