Exploratory Data Analysis – All Blog Posts on The Chemical Statistician

This series of posts introduced various methods of exploratory data analysis, providing theoretical backgrounds and practical examples.  Fully commented and readily usable R scripts are available for all topics for you to copy and paste for your own analysis!  Most of these posts involve data visualization and plotting, and I include a lot of detail and comments on how to invoke specific plotting commands in R in these examples.

I will return to this blog post to add new links as I write more tutorials.

Useful R Functions for Exploring a Data Frame

The 5-Number Summary – Two Different Methods in R

Combining Histograms and Density Plots to Examine the Distribution of the Ozone Pollution Data from New York in R

Conceptual Foundations of Histograms – Illustrated with New York’s Ozone Pollution Data

Quantile-Quantile Plots for New York’s Ozone Pollution Data

Kernel Density Estimation and Rug Plots in R on Ozone Data in New York and Ozonopolis

2 Ways of Plotting Empirical Cumulative Distribution Functions in R

Conceptual Foundations of Empirical Cumulative Distribution Functions

Combining Box Plots and Kernel Density Plots into Violin Plots for Ozone Pollution Data

Kernel Density Estimation – Conceptual Foundations

Variations of Box Plots in R for Ozone Concentrations in New York City and Ozonopolis

Computing Descriptive Statistics in R for Data on Ozone Pollution in New York City

How to Get the Frequency Table of a Categorical Variable as a Data Frame in R

The advantages of using count() to get N-way frequency tables as data frames in R
Exploratory Data Analysis: Quantile-Quantile Plots for New York’s Ozone Pollution Data

Introduction

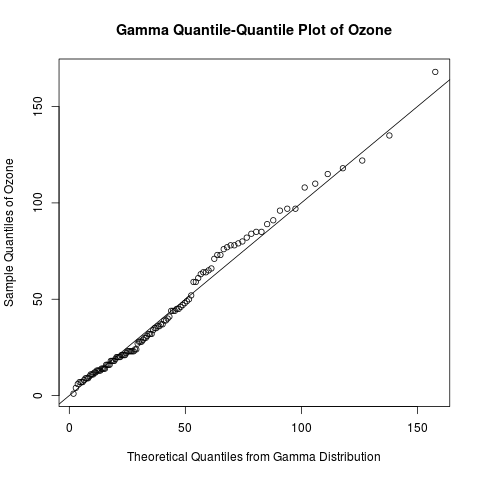
Continuing my recent series on exploratory data analysis, today’s post focuses on quantile-quantile (Q-Q) plots, which are very useful plots for assessing how closely a data set fits a particular distribution.  I will discuss how Q-Q plots are constructed and use Q-Q plots to assess the distribution of the “Ozone” data from the built-in “airquality” data set in R.

Previous posts in this series on EDA include

gamma qq-plot ozone

Learn how to create a quantile-quantile plot like this one with R code in the rest of this blog!

Read more of this post

How to Calculate a Partial Correlation Coefficient in R: An Example with Oxidizing Ammonia to Make Nitric Acid

Introduction

Today, I will talk about the math behind calculating partial correlation and illustrate the computation in R.  The computation uses an example involving the oxidation of ammonia to make nitric acid, and this example comes from a built-in data set in R called stackloss.

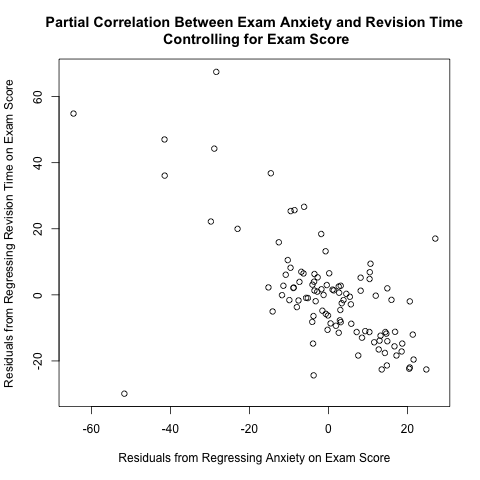
I read Pages 234-237 in Section 6.6 of “Discovering Statistics Using R” by Andy Field, Jeremy Miles, and Zoe Field to learn about partial correlation.  They used a data set called “Exam Anxiety.dat” available from their companion web site (look under “6 Correlation”) to illustrate this concept; they calculated the partial correlation coefficient between exam anxiety and revision time while controlling for exam score.  As I discuss further below, the plot between the 2 above residuals helps to illustrate the calculation of partial correlation coefficients.  This plot makes intuitive sense; if you take more time to study for an exam, you tend to have less exam anxiety, so there is a negative correlation between revision time and exam anxiety.

residuals plot anxiety and revision time controlling exam score

They used a function called pcor() in a package called “ggm”; however, I suspect that this package is no longer working properly, because it depends on a deprecated package called “RBGL” (i.e. “RBGL” is no longer available in CRAN).  See this discussion thread for further information.  Thus, I wrote my own R function to illustrate partial correlation.

Partial correlation is the correlation between 2 random variables while holding other variables constant.  To calculate the partial correlation between X and Y while holding Z constant (or controlling for the effect of Z, or averaging out Z),

Read more of this post