How to Calculate a Partial Correlation Coefficient in R: An Example with Oxidizing Ammonia to Make Nitric Acid
May 5, 2013 9 Comments
Introduction
Today, I will talk about the math behind calculating partial correlation and illustrate the computation in R. The computation uses an example involving the oxidation of ammonia to make nitric acid, and this example comes from a built-in data set in R called stackloss.
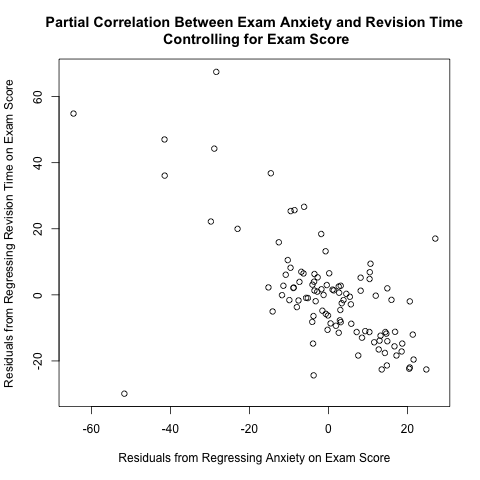
I read Pages 234-237 in Section 6.6 of “Discovering Statistics Using R” by Andy Field, Jeremy Miles, and Zoe Field to learn about partial correlation. They used a data set called “Exam Anxiety.dat” available from their companion web site (look under “6 Correlation”) to illustrate this concept; they calculated the partial correlation coefficient between exam anxiety and revision time while controlling for exam score. As I discuss further below, the plot between the 2 above residuals helps to illustrate the calculation of partial correlation coefficients. This plot makes intuitive sense; if you take more time to study for an exam, you tend to have less exam anxiety, so there is a negative correlation between revision time and exam anxiety.
They used a function called pcor() in a package called “ggm”; however, I suspect that this package is no longer working properly, because it depends on a deprecated package called “RBGL” (i.e. “RBGL” is no longer available in CRAN). See this discussion thread for further information. Thus, I wrote my own R function to illustrate partial correlation.
Partial correlation is the correlation between 2 random variables while holding other variables constant. To calculate the partial correlation between X and Y while holding Z constant (or controlling for the effect of Z, or averaging out Z),

Recent Comments