Introduction
The Ideal Gas Law,  , is a very simple yet useful relationship that describes the behaviours of many gases pretty well in many situations. It is “Ideal” because it makes some assumptions about gas particles that make the math and the physics easy to work with; in fact, the simplicity that arises from these assumptions allows the Ideal Gas Law to be easily derived from the kinetic theory of gases. However, there are situations in which those assumptions are not valid, and, hence, the Ideal Gas Law fails.
Boyle’s law is inherently a part of the Ideal Gas Law. It states that, at a given temperature, the pressure of an ideal gas is inversely proportional to its volume. Equivalently, it states the product of the pressure and the volume of an ideal gas is a constant at a given temperature.

An Example of The Failure of the Ideal Gas Law
This law is valid for many gases in many situations, but consider the following data on the pressure and volume of 1.000 g of oxygen at 0 degrees Celsius. I found this data set in Chapter 5.2 of “General Chemistry” by Darrell Ebbing and Steven Gammon.
               Pressure (atm)      Volume (L)              Pressure X Volume (atm*L)
[1,]           0.25                2.8010                  0.700250
[2,]           0.50                1.4000                  0.700000
[3,]           0.75                0.9333                  0.699975
[4,]           1.00                0.6998                  0.699800
[5,]           2.00                0.3495                  0.699000
[6,]           3.00                0.2328                  0.698400
[7,]           4.00                0.1744                  0.697600
[8,]           5.00                0.1394                  0.697000
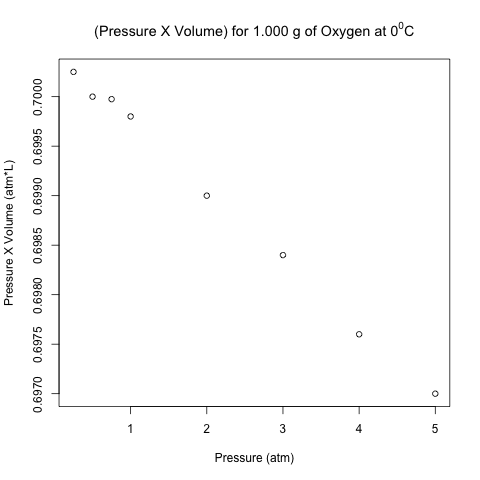
The right-most column is the product of pressure and temperature, and it is not constant. However, are the differences between these values significant, or could it be due to some random variation (perhaps round-off error)?
Here is the scatter plot of the pressure-volume product with respect to pressure.

These points don’t look like they are on a horizontal line! Let’s analyze these data using normal linear least-squares regression in R.
Read more of this post


Recent Comments