Exploratory Data Analysis: Combining Histograms and Density Plots to Examine the Distribution of the Ozone Pollution Data from New York in R

Introduction

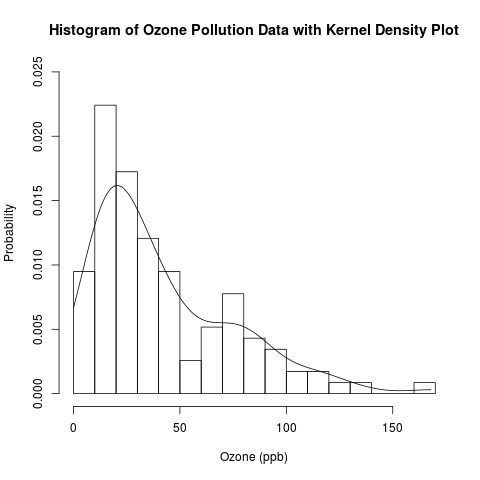
This is a follow-up post to my recent introduction of histograms.  Previously, I presented the conceptual foundations of histograms and used a histogram to approximate the distribution of the “Ozone” data from the built-in data set “airquality” in R.  Today, I will examine this distribution in more detail by overlaying the histogram with parametric and non-parametric kernel density plots.  I will finally answer the question that I have asked (and hinted to answer) several times: Are the “Ozone” data normally distributed, or is another distribution more suitable?

histogram and kernel density plot

Read the rest of this post to learn how to combine histograms with density curves like this above plot!

This is another post in my continuing series on exploratory data analysis (EDA).  Previous posts in this series on EDA include

Read more of this post

Exploratory Data Analysis: Conceptual Foundations of Histograms – Illustrated with New York’s Ozone Pollution Data

Introduction

Continuing my recent series on exploratory data analysis (EDA), today’s post focuses on histograms, which are very useful plots for visualizing the distribution of a data set.  I will discuss how histograms are constructed and use histograms to assess the distribution of the “Ozone” data from the built-in “airquality” data set in R.  In a later post, I will assess the distribution of the “Ozone” data in greater depth by combining histograms with various types of density plots.

Previous posts in this series on EDA include

histogram

Read the rest of this post to learn how to construct a histogram and get the R code for producing the above plot!

Read more of this post

Exploratory Data Analysis – Kernel Density Estimation and Rug Plots in R on Ozone Data in New York and Ozonopolis

Update on July 15, 2013:

Thanks to Harlan Nelson for noting on AnalyticBridge that the ozone concentrations for both New York and Ozonopolis are non-negative quantities, so their kernel density plot should have non-negative support sets.  This has been corrected in this post by

– defining new variables called max.ozone and max.ozone2

– using the options “from = 0” and “to = max.ozone” or “to = max.ozone2” in the density() function when defining density.ozone and density.ozone2 in the R code.

Update on February 2, 2014:

Harlan also noted in the above comment that any truncated kernel density estimator (KDE) from density() in R does not integrate to 1 over its support set.  Thanks to Julian Richer Daily for suggesting on AnalyticBridge to scale any truncated kernel density estimator (KDE) from density() by its integral to get a KDE that integrates to 1 over its support set.  I have used my own function for trapezoidal integration to do so, and this has been added below.

I thank everyone for your patience while I took the time to write a post about numerical integration before posting this correction.  I was in the process of moving between jobs and cities when Harlan first brought this issue to my attention, and I had also been planning a major expansion of this blog since then.  I am glad that I have finally started a series on numerical integration to provide the conceptual background for the correction of this error, and I hope that they are helpful.  I recognize that this is a rather late correction, and I apologize for any confusion.

For the sake of brevity, this post has been created from the second half of a previous long post on kernel density estimation.  This second half focuses on constructing kernel density plots and rug plots in R.  The first half focused on the conceptual foundations of kernel density estimation.

Introduction

This post follows the recent introduction of the conceptual foundations of kernel density estimation.  It uses the “Ozone” data from the built-in “airquality” data set in R and the previously simulated ozone data for the fictitious city of “Ozonopolis” to illustrate how to construct kernel density plots in R.  It also introduces rug plots, shows how they can complement kernel density plots, and shows how to construct them in R.

This is another post in a recent series on exploratory data analysis, which has included posts on descriptive statistics, box plots, violin plots, the conceptual foundations of empirical cumulative distribution functions (CDFs), and how to plot empirical CDFs in R.

kernel density plot with rug plot ozone New York

Read the rest of this post to learn how to create the above combination of a kernel density plot and a rug plot!

Read more of this post
Exploratory Data Analysis: Combining Box Plots and Kernel Density Plots into Violin Plots for Ozone Pollution Data

Introduction

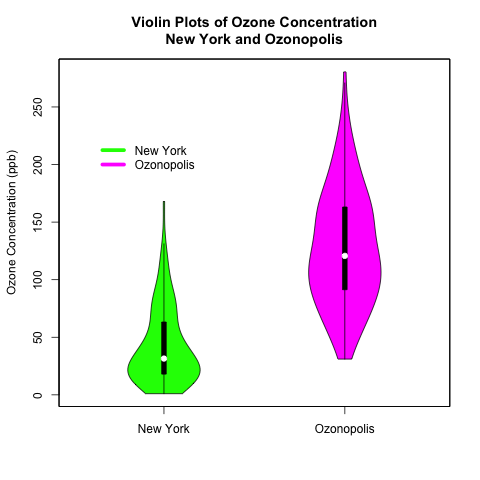
Recently, I began a series on exploratory data analysis (EDA), and I have written about descriptive statistics, box plots, and kernel density plots so far.  As previously mentioned in my post on box plots, there is a way to combine box plots and kernel density plots.  This combination results in violin plots, and I will show how to create them in R today.

Continuing from my previous posts on EDA, I will use 2 univariate data sets.  One is the “ozone” data vector that is part of the “airquality” data set that is built into R; this data set contains data on New York’s air pollution.  The other is a simulated data set of ozone pollution in a fictitious city called “Ozonopolis”.  It is important to remember that the ozone data from New York has missing values, and this has created complications that needed to be addressed in previous posts; missing values need to be addressed for violin plots, too, and in a different way than before.  

The vioplot() command in the “vioplot” package creates violin plots; the plotting options in this function are different and less versatile than other plotting functions that I have used in R.  Thus, I needed to be more creative with the plot(), title(), and axis() functions to create the plots that I want.  Read the details carefully to understand and benefit fully from the code.

violin plots

Read further to learn how to create these violin plots that combine box plots with kernel density plots!  Be careful – the syntax is more complicated than usual!

Read more of this post