Mathematical Statistics Lesson of the Day – An Example of An Ancillary Statistic

Consider 2 random variables, X_1 and X_2, from the normal distribution \text{Normal}(\mu, \sigma^2), where \mu is unknown.  Then the statistic

D = X_1 - X_2

has the distribution

\text{Normal}(0, 2\sigma^2).

The distribution of D does not depend on \mu, so D is an ancillary statistic for \mu.

Note that, if \sigma^2 is unknown, then D is not ancillary for \sigma^2.

Eric’s Enlightenment for Wednesday, April 22, 2015

  1. Frances Woolley’s useful reading list on tax policy for Canadians with disabilities
  2. Jeff Rosenthal asked a seemingly simple yet subtle question about uncorrelated normal random variables.
  3. A great catalogue of colours with their names in R – very useful for data visualization!
  4. Paul Crutzen’s proposed scheme to inject sulfur dioxide into the stratosphere – this would create sulfate aerosols for deflecting sunlight to counteract global warming, but he carefully weighed the serious pros and cons of this risky scheme.

Mathematical and Applied Statistics Lesson of the Day – The Central Limit Theorem Can Apply to the Sum

The central limit theorem (CLT) is often stated in terms of the sample mean of independent and identically distributed random variables.  An often unnoticed or forgotten aspect of the CLT is its applicability to the sample sum of those variables.  Since n, the sample size, is just a constant, it can be multiplied to \bar{X} to obtain \sum_{i = 1}^{n} X_i.  For a sufficiently large n, this new statistic still has an approximately normal distribution, just with a new expected value and a new variance.

\sum_{i = 1}^{n} X_i \overset{approx.}{\sim} \text{Normal} (n\mu, n\sigma^2)

Machine Learning Lesson of the Day – Linear Gaussian Basis Function Models

I recently introduced the use of linear basis function models for supervised learning problems that involve non-linear relationships between the predictors and the target.  A common type of basis function for such models is the Gaussian basis function.  This type of model uses the kernel of the normal (or Gaussian) probability density function (PDF) as the basis function.

\phi_j(x) = exp[-(x - \mu_j)^2 \div 2\sigma^2]

The \sigma in this basis function determines the spacing between the different basis functions that combine to form the model.

Notice that this is just the normal PDF without the scaling factor of 1/\sqrt{2\pi \sigma^2}; the scaling factor ensures that the normal PDF integrates to 1 over its support set.  In a linear basis function model, the regression coefficients are the weights for the basis functions, and these weights will scale Gaussian basis functions to fit the data that are local to \mu_j.  Thus, there is no need to include that scaling factor of 1/\sqrt{2\pi \sigma^2}, because the scaling is already being handled by the regression coefficients.

The Gaussian basis function model is useful because

  • it can model many non-linear relationships between the predictor and the target surprisingly well,
  • each basis function is non-zero over a very small interval and is zero everywhere else.  These local basis functions result in a very sparse design matrix (i.e. one with mostly zeros) that leads to much faster computation.

Mathematical and Applied Statistics Lesson of the Day – The Central Limit Theorem Applies to the Sample Mean

Having taught and tutored introductory statistics numerous times, I often hear students misinterpret the Central Limit Theorem by saying that, as the sample size gets bigger, the distribution of the data approaches a normal distribution.  This is not true.  If your data come from a non-normal distribution, their distribution stays the same regardless of the sample size.

Remember: The Central Limit Theorem says that, if X_1, X_2, ..., X_n is an independent and identically distributed sample of random variables, then the distribution of their sample mean is approximately normal, and this approximation gets better as the sample size gets bigger.

Applied Statistics Lesson of the Day – The Completely Randomized Design with 1 Factor

The simplest experimental design is the completely randomized design with 1 factor.  In this design, each experimental unit is randomly assigned to a factor level.  This design is most useful for a homogeneous population (one that does not have major differences between any sub-populations).  It is appealing because of its simplicity and flexibility – it can be used for a factor with any number of levels, and different treatments can have different sample sizes.  After controlling for confounding variables and choosing the appropriate range and number of levels of the factor, the different treatments are applied to the different groups, and data on the resulting responses are collected.  The means of the response variable in the different groups are compared; if there are significant differences, then there is evidence to suggest that the factor and the response have a causal relationship.  The single-factor analysis of variance (ANOVA) model is most commonly used to analyze the data in such an experiment, but it does assume that the data in each group have a normal distribution, and that all groups have equal variance.  The Kruskal-Wallis test is a non-parametric alternative to ANOVA in analyzing data from single-factor completely randomized experiments.

If the factor has 2 levels, you may think that an independent 2-sample t-test with equal variance can also be used to analyze the data.  This is true, but the square of the t-test statistic in this case is just the F-test statistic in a single-factor ANOVA with 2 groups.  Thus, the results of these 2 tests are the same.  ANOVA generalizes the independent 2-sample t-test with equal variance to more than 2 groups.

Some textbooks state that “random assignment” means random assignment of experimental units to treatments, whereas other textbooks state that it means random assignment of treatments to experimental units.  I don’t think that there is any difference between these 2 definitions, but I welcome your thoughts in the comments.

Exploratory Data Analysis: Quantile-Quantile Plots for New York’s Ozone Pollution Data

Introduction

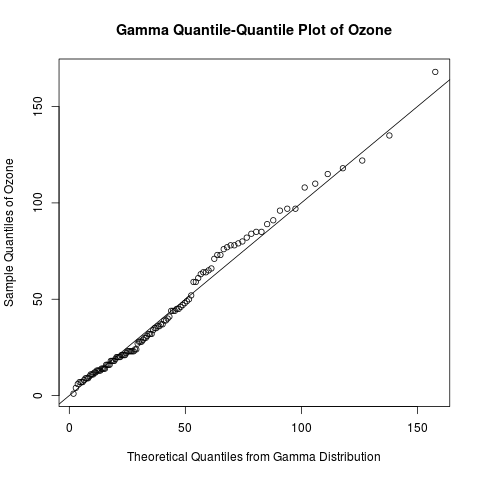
Continuing my recent series on exploratory data analysis, today’s post focuses on quantile-quantile (Q-Q) plots, which are very useful plots for assessing how closely a data set fits a particular distribution.  I will discuss how Q-Q plots are constructed and use Q-Q plots to assess the distribution of the “Ozone” data from the built-in “airquality” data set in R.

Previous posts in this series on EDA include

gamma qq-plot ozone

Learn how to create a quantile-quantile plot like this one with R code in the rest of this blog!

Read more of this post

Exploratory Data Analysis: Combining Histograms and Density Plots to Examine the Distribution of the Ozone Pollution Data from New York in R

Introduction

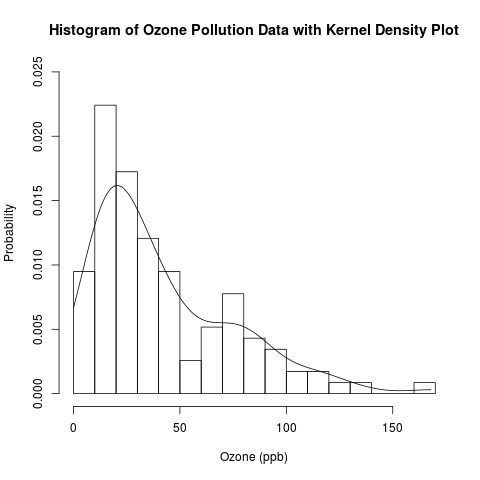
This is a follow-up post to my recent introduction of histograms.  Previously, I presented the conceptual foundations of histograms and used a histogram to approximate the distribution of the “Ozone” data from the built-in data set “airquality” in R.  Today, I will examine this distribution in more detail by overlaying the histogram with parametric and non-parametric kernel density plots.  I will finally answer the question that I have asked (and hinted to answer) several times: Are the “Ozone” data normally distributed, or is another distribution more suitable?

histogram and kernel density plot

Read the rest of this post to learn how to combine histograms with density curves like this above plot!

This is another post in my continuing series on exploratory data analysis (EDA).  Previous posts in this series on EDA include

Read more of this post

Exploratory Data Analysis – Kernel Density Estimation and Rug Plots in R on Ozone Data in New York and Ozonopolis

Update on July 15, 2013:

Thanks to Harlan Nelson for noting on AnalyticBridge that the ozone concentrations for both New York and Ozonopolis are non-negative quantities, so their kernel density plot should have non-negative support sets.  This has been corrected in this post by

– defining new variables called max.ozone and max.ozone2

– using the options “from = 0” and “to = max.ozone” or “to = max.ozone2” in the density() function when defining density.ozone and density.ozone2 in the R code.

Update on February 2, 2014:

Harlan also noted in the above comment that any truncated kernel density estimator (KDE) from density() in R does not integrate to 1 over its support set.  Thanks to Julian Richer Daily for suggesting on AnalyticBridge to scale any truncated kernel density estimator (KDE) from density() by its integral to get a KDE that integrates to 1 over its support set.  I have used my own function for trapezoidal integration to do so, and this has been added below.

I thank everyone for your patience while I took the time to write a post about numerical integration before posting this correction.  I was in the process of moving between jobs and cities when Harlan first brought this issue to my attention, and I had also been planning a major expansion of this blog since then.  I am glad that I have finally started a series on numerical integration to provide the conceptual background for the correction of this error, and I hope that they are helpful.  I recognize that this is a rather late correction, and I apologize for any confusion.

For the sake of brevity, this post has been created from the second half of a previous long post on kernel density estimation.  This second half focuses on constructing kernel density plots and rug plots in R.  The first half focused on the conceptual foundations of kernel density estimation.

Introduction

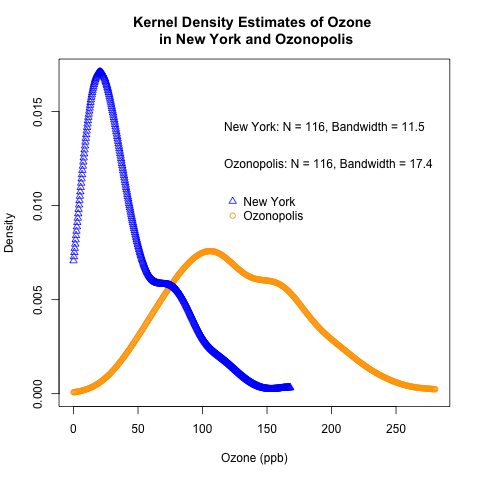
This post follows the recent introduction of the conceptual foundations of kernel density estimation.  It uses the “Ozone” data from the built-in “airquality” data set in R and the previously simulated ozone data for the fictitious city of “Ozonopolis” to illustrate how to construct kernel density plots in R.  It also introduces rug plots, shows how they can complement kernel density plots, and shows how to construct them in R.

This is another post in a recent series on exploratory data analysis, which has included posts on descriptive statistics, box plots, violin plots, the conceptual foundations of empirical cumulative distribution functions (CDFs), and how to plot empirical CDFs in R.

kernel density plot with rug plot ozone New York

Read the rest of this post to learn how to create the above combination of a kernel density plot and a rug plot!

Read more of this post

Exploratory Data Analysis: 2 Ways of Plotting Empirical Cumulative Distribution Functions in R

Introduction

Continuing my recent series on exploratory data analysis (EDA), and following up on the last post on the conceptual foundations of empirical cumulative distribution functions (CDFs), this post shows how to plot them in R.  (Previous posts in this series on EDA include descriptive statistics, box plots, kernel density estimation, and violin plots.)

I will plot empirical CDFs in 2 ways:

  1. using the built-in ecdf() and plot() functions in R
  2. calculating and plotting the cumulative probabilities against the ordered data

Continuing from the previous posts in this series on EDA, I will use the “Ozone” data from the built-in “airquality” data set in R.  Recall that this data set has missing values, and, just as before, this problem needs to be addressed when constructing plots of the empirical CDFs.

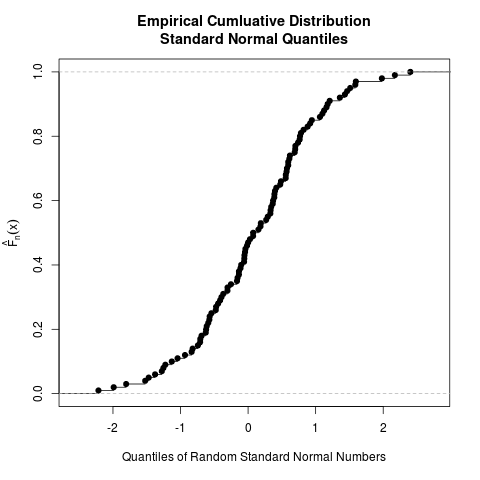
Recall the plot of the empirical CDF of random standard normal numbers in my earlier post on the conceptual foundations of empirical CDFs.  That plot will be compared to the plots of the empirical CDFs of the ozone data to check if they came from a normal distribution.

Read more of this post

Exploratory Data Analysis: Conceptual Foundations of Empirical Cumulative Distribution Functions

Introduction

Continuing my recent series on exploratory data analysis (EDA), this post focuses on the conceptual foundations of empirical cumulative distribution functions (CDFs); in a separate post, I will show how to plot them in R.  (Previous posts in this series include descriptive statistics, box plots, kernel density estimation, and violin plots.)

To give you a sense of what an empirical CDF looks like, here is an example created from 100 randomly generated numbers from the standard normal distribution.  The ecdf() function in R was used to generate this plot; the entire code is provided at the end of this post, but read my next post for more detail on how to generate plots of empirical CDFs in R.

ecdf standard normal

Read to rest of this post to learn what an empirical CDF is and how to produce the above plot!

Read more of this post

Exploratory Data Analysis: Kernel Density Estimation – Conceptual Foundations

For the sake of brevity, this post has been created from the first half of a previous long post on kernel density estimation.  This first half focuses on the conceptual foundations of kernel density estimationThe second half will focus on constructing kernel density plots and rug plots in R.

Introduction

Recently, I began a series on exploratory data analysis; so far, I have written about computing descriptive statistics and creating box plots in R for a univariate data set with missing values.  Today, I will continue this series by introducing the underlying concepts of kernel density estimation, a useful non-parametric technique for visualizing the underlying distribution of a continuous variable.  In the follow-up post, I will show how to construct kernel density estimates and plot them in R.  I will also introduce rug plots and show how they can complement kernel density plots.


kernel density plot ozone


But first – read the rest of this post to learn the conceptual foundations of kernel density estimation.

Read more of this post

Checking for Normality with Quantile Ranges and the Standard Deviation

Introduction

I was reading Michael Trosset’s “An Introduction to Statistical Inference and Its Applications with R”, and I learned a basic but interesting fact about the normal distribution’s interquartile range and standard deviation that I had not learned before.  This turns out to be a good way to check for normality in a data set.

In this post, I introduce several traditional ways of checking for normality (or goodness of fit in general), talk about the method that I learned from Trosset’s book, then build upon this method by possibly coming up with a new way to check for normality.  I have not fully established this idea, so I welcome your thoughts and ideas.

Read more of this post